Orange County Housing Summary
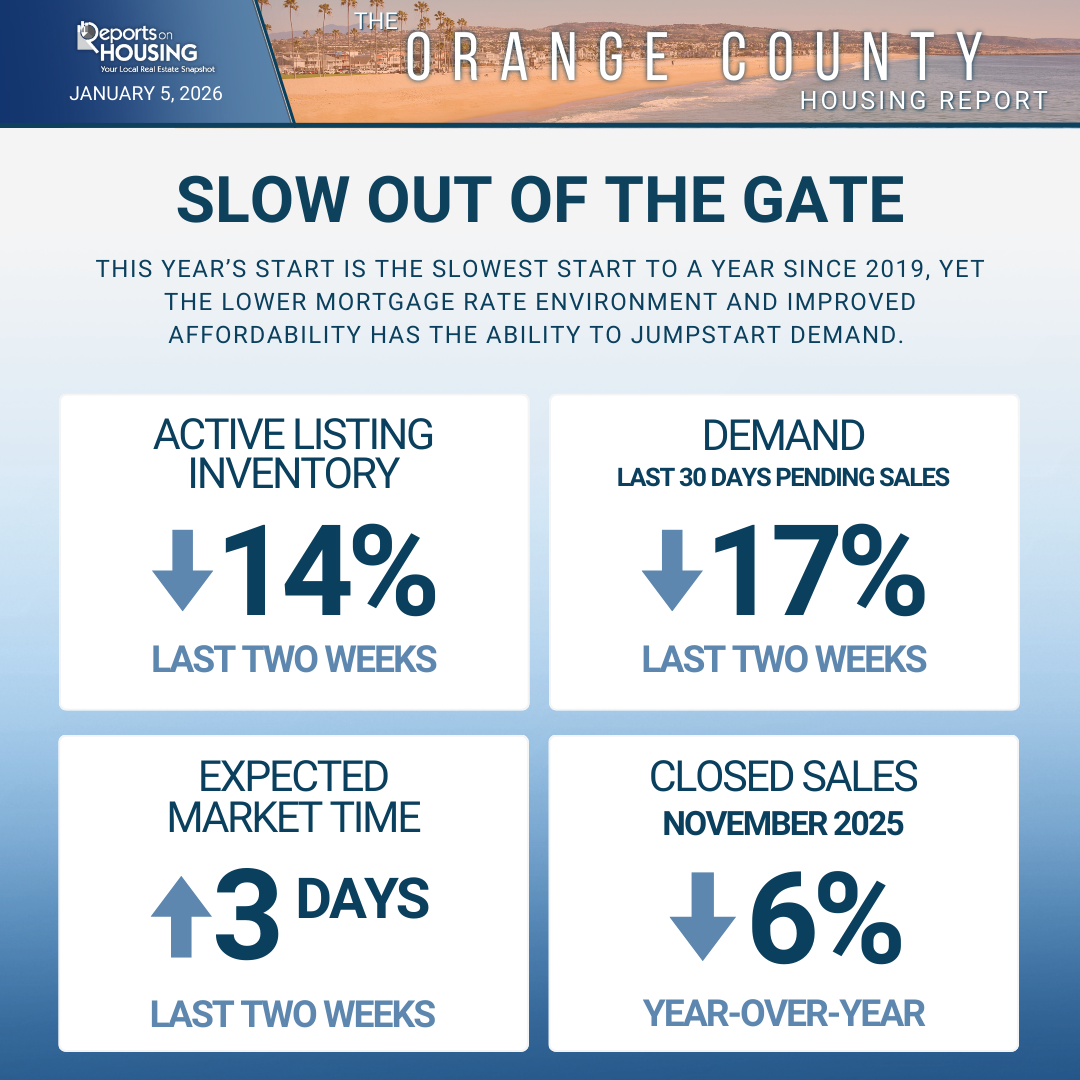
January 5, 2026 – Slow Out of the Gate
INVENTORY: The active listing inventory in the past couple of weeks plunged by 456 homes, down 14%, and now stands at 2,703. Last year, there were 2,401 homes on the market, 302 fewer homes, or 11% less. The 3-year average before COVID (2017 to 2019) was 4,665, which is 73% higher. From January through December, 26% fewer homes came on the market compared to the 3-year average before COVID, 10,215 less. Yet 2,089 more sellers came on the market this year than last year, and 5,808 more than in 2023.
DEMAND: Buyer demand, the number of pending sales over the prior month, sank by 198 in the past two weeks, down 17%, and now stands at 951. Last year, there were 953 pending sales, similar to today. The 3-year average before COVID (2017 to 2019) was 1,349, which is 42% higher.
MARKET TIME: With demand falling faster than supply, the Expected Market Time, the number of days to sell all Orange County listings at the current buying pace, increased from 82 to 85 days in the past couple of weeks. It is the highest start to a year since 2019. Last year, it was 76 days, faster than today. The 3-year average before COVID (2017-2019) was 104 days, more than today.
LUXURY: In the past two weeks, the Expected Market Time for homes priced between $2.5 million and $4 million decreased from 150 to 132 days. For homes priced between $4 million and $6 million, the Expected Market Time increased from 159 to 170 days. For homes priced above $6 million, the Expected Market Time decreased from 298 to 283 days.
DISTRESSED HOMES: Short sales and foreclosures combined, comprised only 0.2% of all listings and 0.6% of demand. Three foreclosures and two short sales are available today in Orange County, bringing the total of distressed homes on the active market to five, down two from two weeks ago. Last year, six distressed homes were on the market, similar to today.
CLOSED SALES: There were 1,487 closed residential resales in November, 6% lower than November 2024’s 1,583 sales, and down 23% from October 2025. The sales-to-list price ratio in Orange County was 97.8%. Foreclosures accounted for 0.1% of all closed sales, and short sales accounted for 0.1%. That means that 99.8% of all sales were sellers with equity.



Responses